Many folks know I love playing with spatial data. In one my current presentations, Spatial Data – Looking Outside the Map, I do a demo creating a floor plan with spatial data and do analysis and reporting against some hotel data. I am actually on my way to Seattle right now and have the great honor to present this at PASS Summit. In the September update there was an exciting feature released to Power BI, custom maps in Power Map. What it essentially allows you to do is to map your data to any image file you want. Seeing some of the examples of what could be done (http://blogs.msdn.com/b/powerbi/archive/2014/10/07/5-minute-tutorial-for-creating-custom-maps-with-excel-and-power-map.aspx) I was excited to see what I could do with my demo hotel data.
I have the click to run version of Office so it runs updates auto-magically. When I opened Excel though I didn’t see the option for custom maps. So I go to File – Account – Update Options and choose Update Now. It runs the update and voila, custom maps.
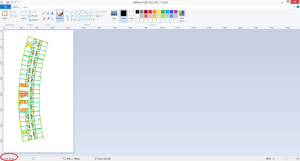
So my data is really typically hotel data that is stored in SQL Server. I like to call my hotel “Plaza Del Hope”. It contains run of the mill information for Plaza Del Hope guests. One of the main things it contains is arrival dates of my hotel guests. I pulled that into Power Pivot and create all the relationships I’ll need. After I have my data in the model in order, now begins the less than super fun part. How custom maps work is that you will use an x, y axis information to detail how your data will relate to the image file. So you will need to create those coordinates. The easiest way to do that is to open your image in Paint. Then you need to make sure your Paint is set to show coordinates in pixels. Mine was not and instead was using inches. If you need to change it then select File – Properties – and then specify the units to be pixels. Then when you hover over your picture, in the lower left it will display the X,Y coordinates for the image.
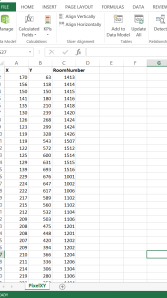
You can see here I am using an image of a hotel floor plan. I want to be able to visualize the data pertaining to the guests staying in the rooms so I need to tie each room to a coordinate. Now comes the tedious portion. I have to go through and get the x,y coordinates for each room on my floor plan. You can see here I put the x axis coordinate, y axis coordinate, and the corresponding room number into the Excel spreadsheet that contained my Power Pivot model. Doing this portion is when I tried to send telepathic messages of my wish to put spatial data support into the Power Map/View/etc tools to the Microsoft folks.
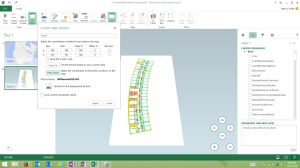
Once I had that I then pulled that info into my model by clicking Add To Model. I then added the relationships that pertain to RoomNumber. Now I was ready to start building my custom map. I open up Power Map (From spreadsheet click the Insert tab – click Map – launch Power Map. I select New Scene – New Custom Map. You can name your custom map scene. I set mine to Hotel. Next I select icon next to “Browse for the background picture”. I then navigated the location for my image that plotted out before. After that I click the Select Pixel Space button and done. I now have a scene that contains the floor plan for my hotel. I wanted the first portion of my tour to contain a view of just the floor plan so I leave this scene alone and create a new scene. I can do this quickly but choosing the Copy Scene option. This second scene is where I want to start showing some data.
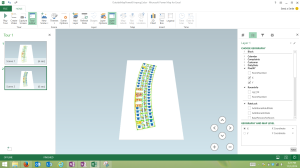
With the second scene active, on the right I will start building my data story. First will specify Geography and Map Level. In the table selection I find the table with the x, y plots (PixelXY). I select X and Y fields and specify they are X coordinate and Y coordinates.
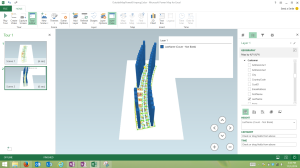
What I want to show is when a guest is staying in the rooms so I select LastName and drag to Height(Count Not Blank). The height is a bit higher than I need it to be so I change that by on right hand pane, clicking the gear looking icon to change settings.
The layer 1 info screen inside custom map isn’t providing any value so I remove that. Next I want to add a time dimension so I will do so by going back to the field list and select ArrivalDate. It will then bring up the play capability on my scene. I am able to click play and can see the arrival of our hotel guest over time and see a visual of what rooms are occupied. Pretty cool huh?!
The X,Y axis plotting is a bit, well not fun but it is definitely a good start. Hopefully this is a stepping stone on the path until we can get spatial data in those tools. The potential for custom maps is exciting and very interested to see how people begin to use them. Please feel free to post in the comments if you have done anything with them.
Below is the full detailed list of steps. Enjoy and have fun with custom maps!
- Open Power Pivot and pull in data.
- Power Pivot – Manage
- From Database – SQL Server
- Create any relationships between your tables pulled in. Can do various ways including dragging and dropping in the diagram view
- Using a date table so marked it as such
- Changed back to Data View
- Click the Design tab – Mark as date table
- Select the date field
- Map out the plots for spaces to use in picture.
- Open picture in Paint
- My paint was showing units in inches as opposed to pixels. To change:
- File – properties – select pixels
- Hover on a point in the picture where something would be you would want to plot. In my case I’m showing the booked rooms in a hotel.
- Capture the x, y axis info. I put in Excel worksheet where I had pulled my data into Power Pivot. I was plotting out hotel rooms so I also put the hotel room number to correlate it to the x,y plot.
- Then I click Add to Data Model
- Created relationship with my new table with existing ones in model based on Room Number
- Create Custom Map
- Go back to Excel workbook
- Select Insert Tab
- Click Map
- Select Launch Power Map
- Select New Scene
- Select New Custom Map
- Name your custom map scene – I set mine to Hotel
- Select icon next to “Browse for the background picture”
- Navigate to and select the picture you plotted out before.
- Select Pixel Space button
- Click Done
- Can now delete the first default scene and our new custom map scene is only one remaining
- I will leave this scene containing only the blank view of the floor plan. Can adjust the scene duration.
- Hover over scene and click on the gear looking icon to change scene options
- On the right I will change the value to 4 in scene duration
- Select New Scene – Copy Scene
- With the second scene active will specify Geography and Map Level
- Find the table that contains the x,y plotting we did before (PixelXY)
- Select X and Y fields and specify they are X coordinate and Y coordinate
- Click Next
- Select LastName and drag to Height – should be Count Not Blank
- On right hand pane – click the gear looking icon to change settings
- Bring the height down a bit
- Remove the layer 1 info screen inside custom map by clicking the x
- Go back to the field list and select ArrivalDate. It will then bring up the play capability on your scene.
- Click play and can see the arrival of our hotel guest over time and see visual of what rooms are occupied.
